I’m fascinated by the world of data analysis. When I first started learning, everyone seemed to use the “Superstore” sales data set in Tableau. It’s a great example, but it got me thinking – what about the data we don’t see?
The Superstore data gives you a clear picture of sales figures, products, and profits. But what if there’s a reason why some cities get steeper discounts than others? The data we use for analysis might not tell the whole story. That’s where dark data comes in – hidden information that could be crucial for understanding the bigger picture. The products in the dataset are: Art Consumables, Binders, Phones, Furnishings, Paper, Chairs, Fasteners, Envelopes, Tables and Office Storages.
Dark data is information you collect but don’t use. It lacks structure, making it hard to analyze with your usual sales info. But within this hidden pile, there might be answers to why things happen, like why some cities get steeper discounts than others.
Let’s use this discount mystery as an example. Your data shows some cities get bigger discounts. Why? Standard sales info might not tell you. But dark data can help uncover hidden factors that influence these discounts.
In this case, the question is: why do some cities get bigger discounts? Here are some possibilities I explored:
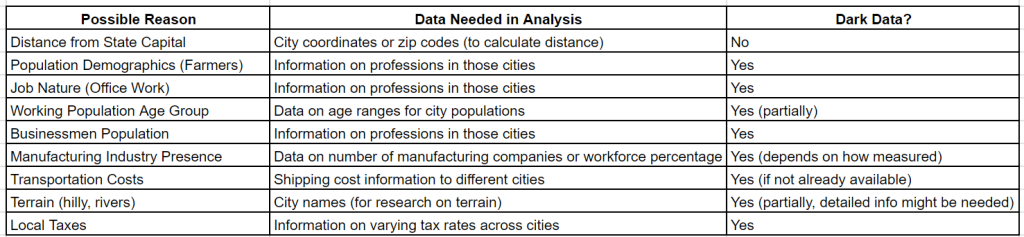
Shining a Light on Dark Data:
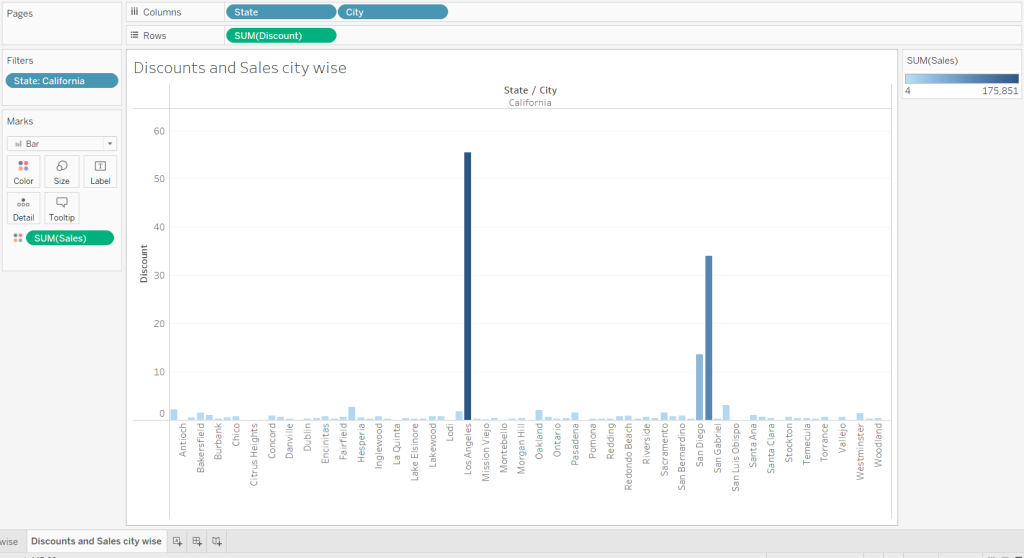
Logistics Problems: The real dark data is in logistics. Cities that are faraway from the state capital may be expensive to deliver, thereby justifying smaller discounts. One more problem could be the presence of Hilly terrains / narrow or rugged roads / mixed mode of transportation like a ferry with a road transport / absence of railway transportation, etc could also increase the freight rates and hence providing discounts may not be possible. ?. As an example, I took the entire list of 81 cities in the dataset from California, of which 74 cities accounted for products with no discount. A further search on the demographics of this state revealed that a significant portion of California’s land is rural, the vast majority of the population resides in urban areas, which concentrates transportation issues like traffic congestion, road maintenance, and public transportation needs within these urban centers. Rural areas, although less populated, face their own unique transportation challenges related to accessibility and infrastructure. I then created a bar chart of Sales and Discount data for each city, which is as shown below. This depicted an interesting pattern, that Sales and Discount both are higher in San Diego and Los Angeles.
People’s Jobs (Farmers): Sales data doesn’t tell you about jobs. This dark data (surveys or public records) might reveal a city with lots of farmers, who might not buy expensive things. The products described in the dataset may not be of daily use to them and hence, there may be very low or no discounts, since these cities may not attract a good sales. I made a search on which states in America are rich in farming and narrowed down on 10 states (Iowa, Nebraska, Kansas, North Dakota, South Dakota, Montana, Mississipi, Arkansas, Idaho and West Virginia). I then looked for the discounts offered in the cities belonging to these states and found 10 out of 45 cities in these cities had a discount of only 20% for certain products. Thus, In states with a lot of farming, the focus should be on selling basic items like phones and furniture that everyone needs (not on high end ones). Offer special discounts on items like art supplies when it’s back-to-school season or for small businesses. Make sure these products are easy to buy and listen to what the local people need to improve sales. Thus, it made sense to me that no discounts were offered in this region.
Similarly, one can also look on the following parameters to collect dark data
Job Type (Office Work): Similar to jobs above, information on professions is dark data for sales databases. Cities with more blue-collar jobs might have different buying habits than office worker towns, affecting discount strategies.
Age of Working People: Sales data might show total sales, but age details are often dark data. Cities with younger or older populations might spend differently, impacting discount strategies.
Number of Businesses: Knowing the prevalence of small businesses (dark data) in a city could be crucial. Businesses might buy differently and be more price-sensitive than individual consumers.
Manufacturing Presence: Sales data might not show the industrial landscape. Researching the number of manufacturing companies (dark data) could be relevant. Cities with a strong manufacturing base might have less demand for certain products, leading to discounts to clear inventory.
Benefits of Using Dark Data:
By using this dark data, we can build a better picture:
- Explain Discount Variations: Understanding demographics, jobs, and local economies can explain why certain cities receive steeper discounts.
- Targeted Strategies: Tailoring discount strategies to specific demographics or job types can lead to more effective promotions and increased sales.
- Improved Forecasting: By considering factors like local taxes and transportation costs (both dark data), companies can forecast sales performance more accurately across different regions.
The Path to Uncovering Dark Data:
While using dark data adds complexity, the benefits are significant. Here are some steps to get started:
- Find Potential Dark Data: Look for factors that might influence sales but aren’t currently included in your analysis.
- Get the Data: Explore publicly available data sources, conduct surveys, or partner with external data providers.
- Integrate the Data: Clean and structure the collected dark data to seamlessly integrate it with your existing sales data.
The Bottom Line:
Sales analysis goes beyond the readily available numbers. By venturing into the realm of dark data, we unlock a hidden treasure trove of insights. By incorporating information on demographics, professions, and local economies, we can explain discount variations, target strategies more effectively, and ultimately boost sales performance. So, next time you analyze sales data, remember – the most valuable answers might just be hiding in the shadows.